

Focus Time: how productivity and quality was improved in a different time
Lessons learned that lead to 15% productivity increase and a better work stream.

Productivity for agile teams and the factors affecting it was something that always caught my attention. As a developer with many years of experience working in different environments, I often experienced managers burning out teams in the name of better results, but not working to understand the causes of productivity loss. This type of experiences always pushed me to find a solution that would not harm the quality, client or team.

One of my first opportunities to investigate productivity happened approximately ten years ago. I was running my own company and managing a team of talented developers. As the organization grew, I saw the productivity numbers going down, despite the fact happiness, turnover, and other similar indicators were stable or even improving.
Lately, I found out how interruptions — context switching — was a lousy contributor for those numbers. The study was the seed to create the concept which after we named focus time. After some mistakes and adjustments, we were able to experience 15% in productivity increase. It was also instrumental in understanding and improving our processes in general.
This particular experience I am about to describe is related to specific conditions and environment I was surrounded by during that study. For instance, pressure, workload and other internal and external variables also have a play in productivity — which I might address in a future post.
In God we trust; all others bring data — W. Edwards Deming.

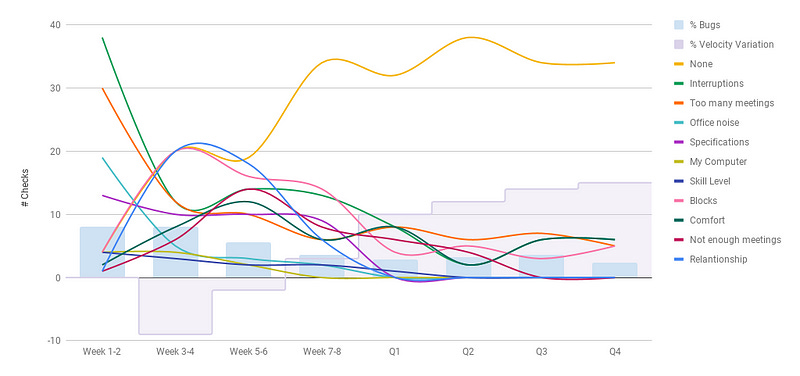
To discover, measure and quantify the issues related to productivity, I created an internal survey to capture data from the team. I was collecting responses every two weeks until the end of the first year eventually integrating the poll as part of the quarterly reviews to evaluate progress.
The question was: What are the factors that are affecting your productivity? Each person had three votes and could vote multiple times on the same topic, at least one vote was mandatory. The options provided were:
None — I feel that I am as productive as much as I could be
Comfort (lights, desk, a/c, chair, monitor etc.)
My computer (speed, memory, old hardware etc.)
Too many meetings
Not enough meetings
Interruptions (related or unrelated to work)
Office noise (conversations, telephone, doors etc.)
Lack of specifications or details in the tasks
My skill level for the project’s stack
My relationship with the team or someone specific
Blocks or dependent tasks
The options above were created based on asking the managers to capture common complaints made during 1on1s and lessons learned sessions.
Lately, that poll evolved into a survey with way more questions to analyze other aspects. Having these numbers combined with other management techniques lead to a happier team and ultimately increased client satisfaction. I will not go over the complete version of my studies so as to avoid unnecessary complexity in this article. The idea is to give you insights and not a framework.
General Notes
We decided to use a 2-week format for a reason: to get the results in the first week, discuss with the team, implement the changes and test for at least eight workdays.
The % Velocity Variation reflects the team’s velocity in comparison to week 0. For example, the 8% increase in week 7–8 is related to week 0 and not week 5–6.
The comfort index variation along the weeks was something that I could never fully understand — we never introduced anything that would justify that behaviour. The best explanation we could come up with was that not having something else essential to report, the comfort came into evidence for some people.
At the time that I started doing this measurement, flexible hours and other modern ways of working were not part of my workplace in Brazil. Further ahead, you might be surprised by reading something that seems unconventional nowadays. The facts below are contextual and a way to share failures and successes during the process of improvement.
Week 1 and 2
The numbers in Week 1–2 column shows the first round of results from the poll. By selecting the issues with more than 10%, we have the top 4: Interruptions, Too Many Meetings, Office Noise and Lack of Specifications.
During the brainstorm with the team, we decided each individual would create an event with 5 hours duration on their calendar. During those hours, meetings, calls, emails, interruptions from others or instant messaging were not allowed — except emergencies of course. We were willing to reduce the number of interruptions and meetings with that approach. This decision was a mistake, which I explain further ahead.
For the office noise, we established that any conversations more prolonged than a couple of minutes should be held in a meeting room. We also moved printers to a separated place and replaced one of the local servers because of its cooling system noise. The kitchen was reorganized in a way that loud machines (coffee grinder, microwave) were placed further away from the door.
The lack of specification was related to a particular project. We worked with the client’s product owner to establish a better way to gather information, and it was enough to improve the process hence the poll results.
The issues reported with computers were addressed by replacing the hardware with new machines. It took a while to see that reflected in the numbers because at that time in Brazil, buying computers were a 3 to 4 weeks process — awkward times.
The skill level was addressed with books and courses paid by the company and coaching sessions with colleagues greater expertise in the requested topics of interest.
The key is not to prioritize what’s on your schedule but to schedule your priorities — Stephen Covey
Week 3 and 4
Besides the interruptions index decrease from 38 to 12 and the meetings index from 30 to 12 combined with an increase from 4 to 20 points for feeling complete productive; allowing each member of the team to block their calendars as per their criteria was not a right decision. We created a situation where it was almost impossible to set a meeting with everyone other than the standup, sprint planning and the retrospectives. We created a situation where developers and project managers were in constant conflict. It is possible to see it reflected in the relationship and number of members being blocked growing to 20 points each.
The velocity shrank 9%, which was a good indicator that something was wrong. For the first time in my career, I could see how much team-relationship impacts productivity as much as other factors. I am glad that I had the opportunity to learn this in my early days as a manager.

Lesson learned, we decided that everyone would block the same time period off their calendars during the day, from 10 am to 4 pm. Because of this arrangement, we named it Focus Time.
For context: In Brazil, it is common to have a 1-hour lunch break. Meaning the total duration of the focus time was 5 hours instead of 6 hours.
Week 5 and 6
The numbers, in general, were slightly better. Velocity was recovered close to the starting point. The index for the lack of meetings had a jump from 6 to 14 points, but the number of blocks and the excess of meetings had both small improvements. Keeping those numbers in mind, I understood that we were experiencing an adjustment phase.
The most concerning number was again the relationship. Discussing the matter with the team, having a fixed time for the focus time was not enough to solve the conflicts. Having roughly 3 hours to interact and have meetings was not sufficient. We decided to reduce the focus time from 5 to 3 hours per day, starting at 10 am and ending at 2 pm.
Week 7 and 8
It was a relief seeing the improvements in velocity (3%) but mainly the relationship problems dropping to 6 points. Those numbers reflected in the team feeling more productive — from 19 to 34 points.
However, the number of blocks were almost the same as the previous measurement. The team brought to the discussion the last hour of the focus time was not productive as much as it could be, because of the lunch break. It was vital to understand the Focus Time should not have significant interval gaps.
We decided to change the focus time to start at 9 am and end at noon. standups were happening between 8:30 am, and 9 am or in the afternoon. We also agreed task blocks posing a risk or impact at medium to high levels should be exceptions to break the Focus Time. The latest tweaks to our strategy worked well because we already had a sharp system to rank risks and threats. Therefore feelings and interpretations were not a common problem interfering in the results.
Quarters
Given the significant improvements observed in Week 9, we decided to change the frequency from bi-weekly to quarterly. The gain experienced in the subsequent quarters were related to stabilization of the Focus Time practice, on-boarding of new members and other processes.
By the 4th quarter, we adopted practices to let the team decide their norms and ways to prevent interruptions and team conflicts. Some teams chose to keep the Focus Time, adjusting it as needed. Other groups decided to create different forms to work together. For example, using a headphone was the signal not to be interrupted.
In the 1st quarter of the new year, I sold my shares and left the company. Recently, while catching up with the current CEO of the company, I learned the practice still in use and constantly being improved upon
During my career, I had the chance to evolve the approach and implement in different companies, cultures and countries. I do not call it Focus Time anymore, but I still trust the team to map processes and issues and how to improve them. They are the primary source of truth, and during these years, I could not find a better and effective way to improve productivity.
Trusting and hearing the team, showing care by working to solve their concerns and issues is a key factor for improvement. From a different angle; it is possible to see a clear connection between quality and team morale. Having a motivated, empowered, and engaged team will drive the improvements in the indicators that every executive wants to see; including productivity.
I would like to thank Baggio Wong for constructive criticism of this article